1. Prometheus Setup
|
Available since |
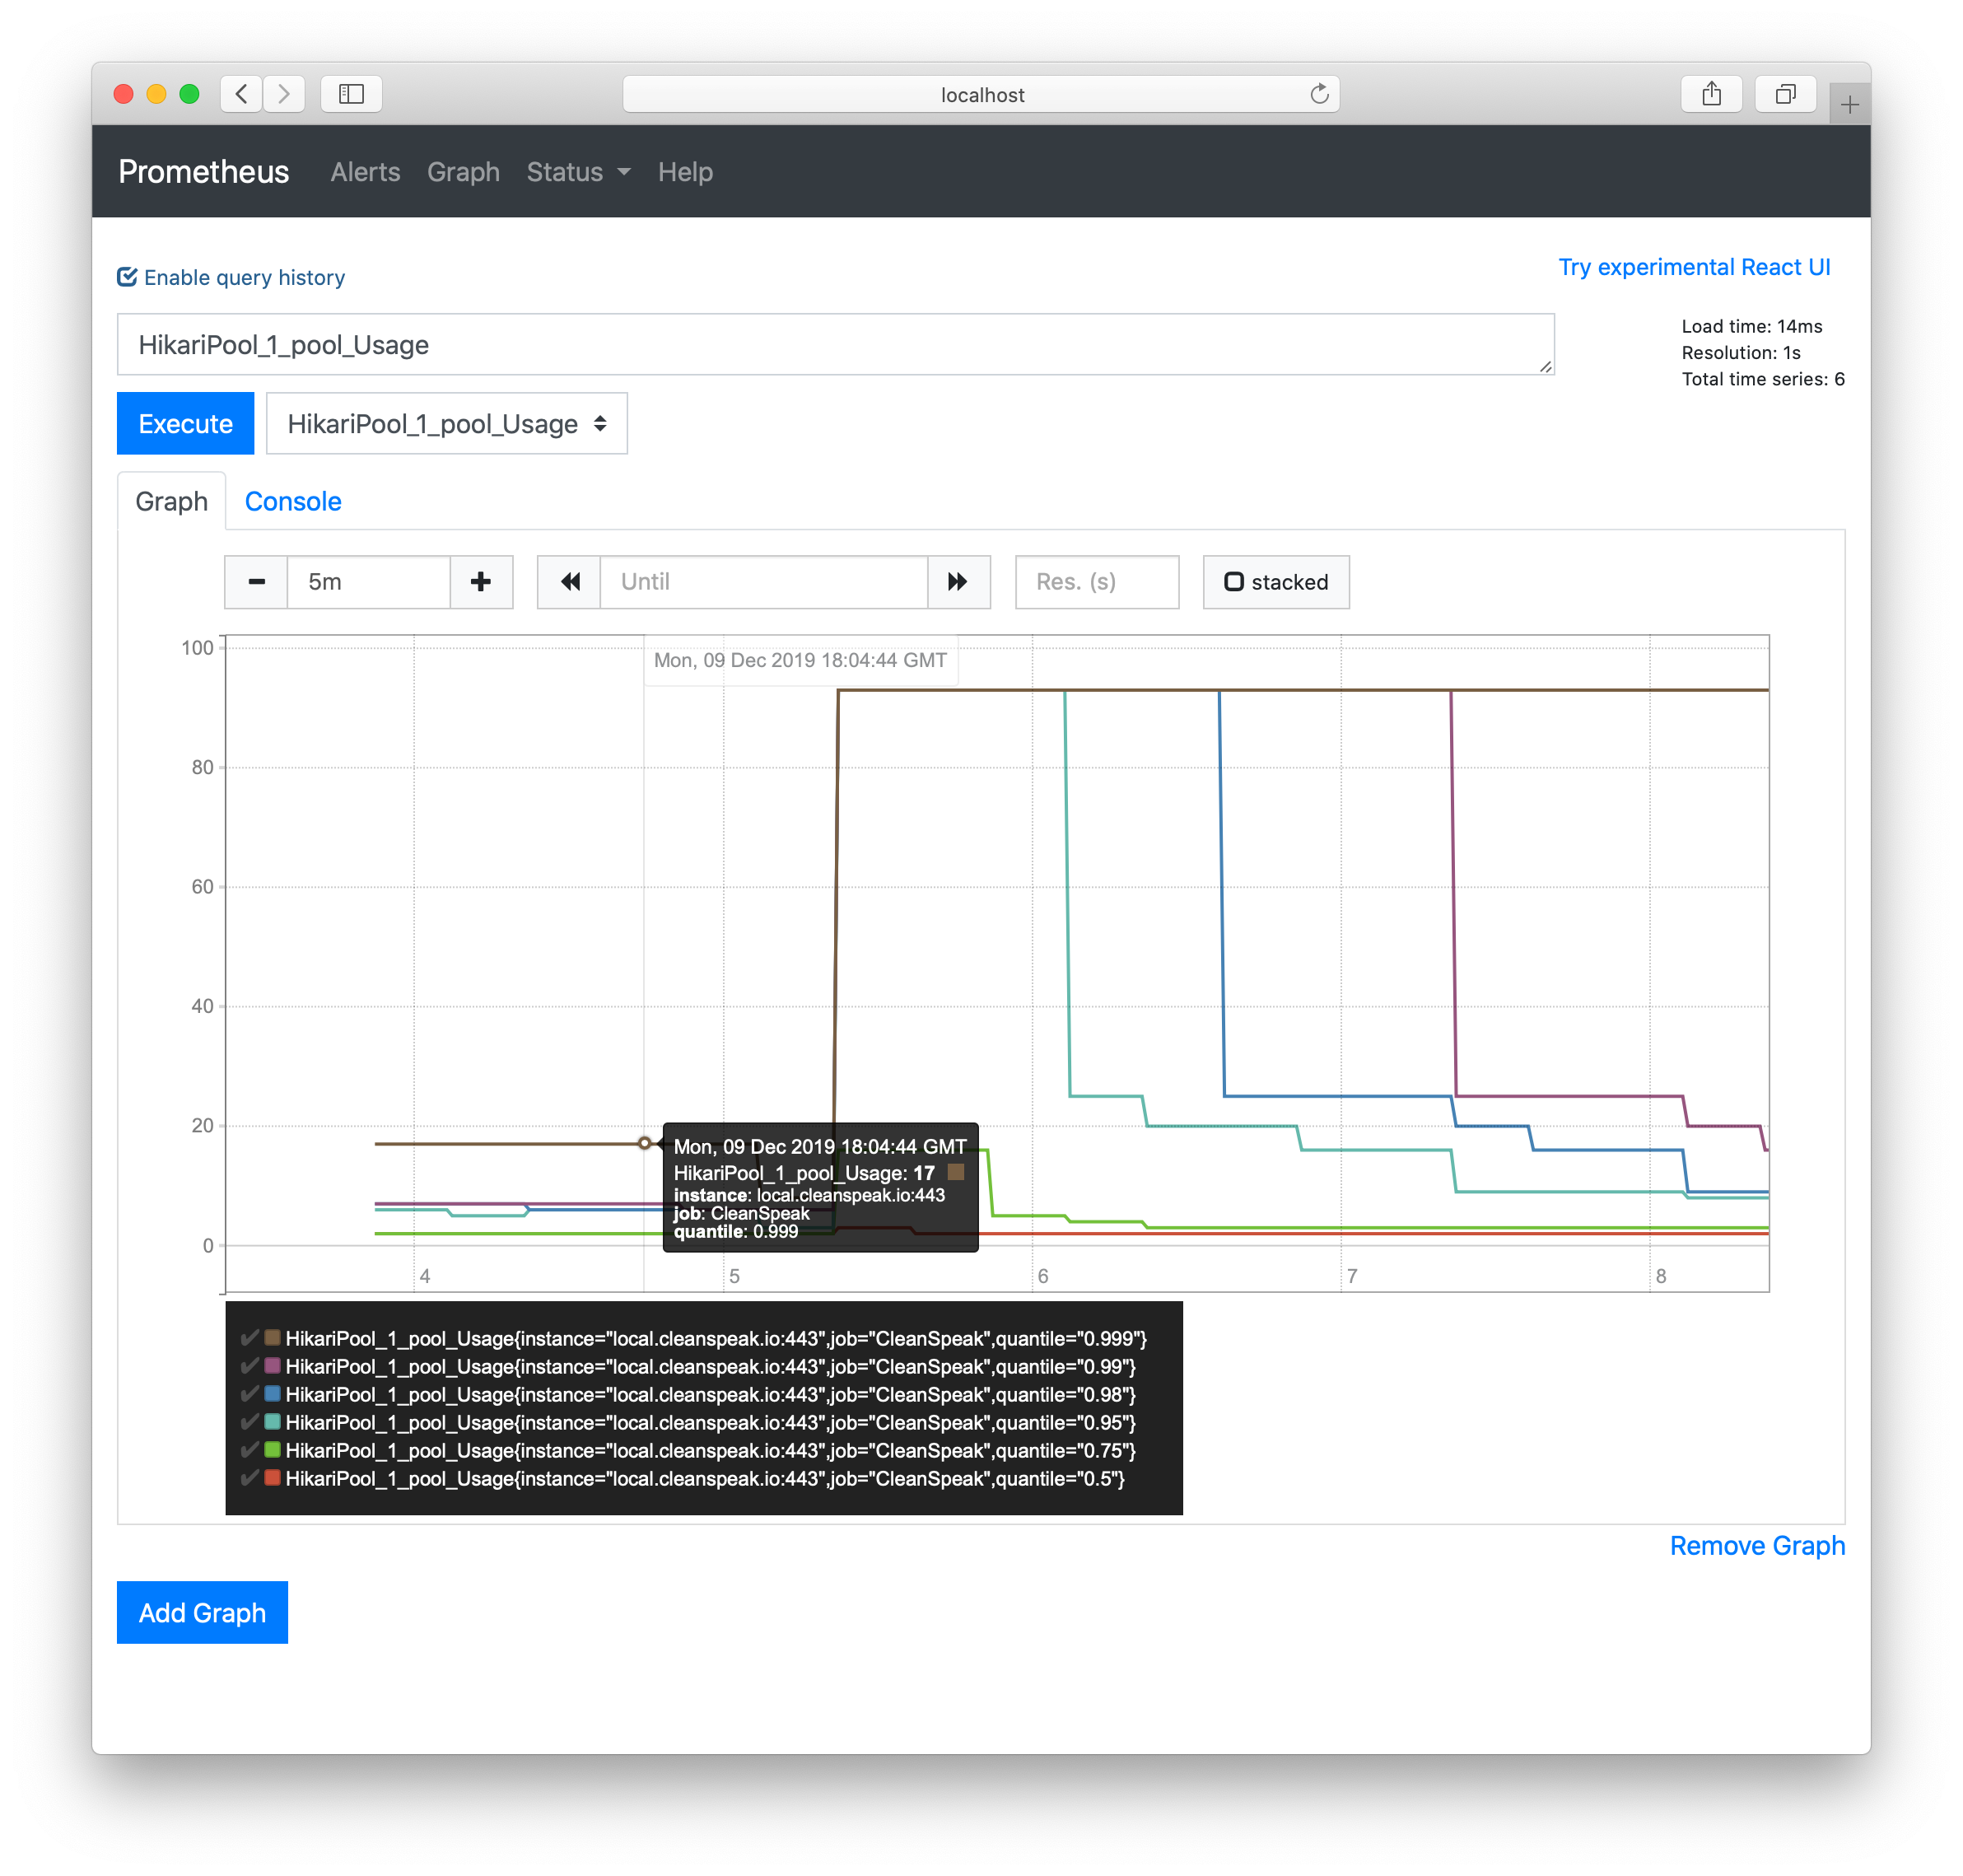
Prometheus is a tool to monitor metrics and setup alerts in the case that some metric has responded negatively for an extended period. Setting this up with CleanSpeak is easy.
1.1. Setup
The primary requirement to hookup CleanSpeak is to direct Prometheus to the CleanSpeak endpoints. We used the following configuration for a CleanSpeak instance running locally on the docker host. (You can reach the docker host using the hostname host.docker.internal on macOS and Windows. By default, for 4.x, CleanSpeak runs on 8001 and for 3.x the CleanSpeak Management Interface runs on 8011 and CleanSpeak Webservice runs on 8001)
scrape_configs:
  - job_name: CleanSpeak
    metrics_path: /prometheus/metrics
    scheme: https
    static_configs:
- targets: ['local.cleanspeak.io:8011', 'local-api.cleanspeak.io:8001']scrape_configs:
- job_name: CleanSpeak
metrics_path: /prometheus/metrics
scheme: http
static_configs:
- targets: ['host.docker.internal:8001']
basic_auth:
# this should literally be apikey
username: "apikey"
# Put your key, configured in CleanSpeak, here
password: "your_api_key"|
In CleanSpeak 4.x, you must either supply an API key, as the example above does, OR connect from localhost with |
We then started prometheus with
docker run -v $(pwd)/prometheus.yaml:/etc/prometheus/prometheus.yml -p 9090:9090 prom/prometheus